Infrared cavity ringdown spectroscopy of water clusters: O– D stretching bands
J. B. Paul, R. A. Provencal, C. Chapo, A. Petterson, and R. J. Saykally
Department of Chemistry, University of California, Berkeley, California 94720
Received 3 August 1998; accepted 9 September 1998
The infrared O – D stretching spectrum of fully deuterated jet-cooled water clusters is reported.
Sequential red-shifts in the single donor O – D stretches, which characterize the cooperative effects
in the hydrogen bond network, were accurately measured for clusters up to ( D2O) 8 . Detailed
comparisons with corresponding data obtained for ( H2O) n clusters are presented. Additionally,
rotational analyses of two D2O dimer bands are presented. These measurements were made possible
by the advent of infrared cavity ringdown laser absorption spectroscopy IR-CRLAS using
Raman-shifted pulsed dye lasers, which creates many new opportunities for gas phase IR
spectroscopy.
© 1998 American Institute of Physics. S0021-9606 98 00847-2
Инфракрасная спектроскопия водяных кластеров
I. INTRODUCTION
There is much current interest in the study of gaseous
water clusters by modern laser spectroscopy methods,1 – 3 as
such studies promise a route to an enhanced understanding of
the enigmatic condensed phase behavior of water.4 In addi
tion to vibration-rotation tunneling VRT spectra that probe
cluster structures and intermolecular force elds,1 measure
ments of the stretching and bending vibrations of the chemi
cal O – H bonds are crucial because these directly probe the
cooperativity in the hydrogen bond network and the geomet
ric distortion of the water monomer that accompanies H
bond formation. Moreover, it is important to obtain data for
several isotopomers, as these provide exacting constraints on
the force eld determination. Previous gas phase IR
measurements5 – 9 have been restricted to the O – H stretch re
gion 2.6 – 3.0 m because of the lack of suitable light
sources to extend the frequency coverage to other regions.
Here we report the application of the novel and more general
cavity ringdown laser absorption spectroscopy CRLAS
technique for the rst measurement of the O – D stretch vi
brations in jet-cooled ( D2O n clusters, which provides new
insight into the nature of water cluster vibrations. The spec
trometer used in this study operates continuously in the
2.5 – 7 m spectral region, with an average fractional absorp
tion sensitivity of 1 – 2 ppm.
Water cluster O – H stretch fundamentals were rst ob
served in the gas phase by Lee and co-workers,6 using an
approach based on vibrationally predissociating the weakly
bound clusters with a pulsed, tunable OPO laser operating in
the 3 m region. Limitations in nonlinear crystal technology
that continue to exist today prevent these lasers from gener
ating usable power at wavelengths longer than 4.0 m, thus
precluding studies of the corresponding stretching bands in
D2O clusters. Subsequently, many other gas phase studies of
water clusters have been reported.5,8,10,11 Other studies of
water clusters include matrix isolation experiments12,13 and
theoretical14,15 calculations.
Studies of fully deuterated water clusters in the O – D
stretching region are now made possible by the advent of the
IR-CRLAS method, which has been described
previously.16,17 For the dimer, this has already produced an
improved understanding of the ground and excited state ac
ceptor tunneling dynamics of the acceptor anti-symmetric
stretch.16 In the present work, we have recorded the discrete
absorption bands of ( D2O) n clusters ( n 9 ) , including a de
tailed analysis of two additional dimer bands, which are
complicated by the numerous tunneling effects and are only
partially rotationally resolved. Additionally, a continuum ab
sorption associated with clusters ranging in size from hun
dreds to thousands of water molecules per cluster is dis
cussed. These new results are compared with those for H2O
clusters in the gas phase, and D2O clusters in rare-gas matri
ces.
II. EXPERIMENT
The IR-CRLAS apparatus used to conduct these experi
ments has been discussed previously.16,18 Brie y, tunable in
frared radiation is generated by Raman shifting a pulsed dye
laser Lambda Physik f13002e into the third-Stokes band
using a multi-pass cell containing 200 p.s.i. of H2 gas. The
bandwidth of the dye laser was switchable from 0.2 to 0.04
cm 1 by installing an intracavity etalon. After spectral lter
ing, the laser light is aligned into a two mirror Ringdown
cavity. The light leaving the cavity is focused by a 10 cm
lens onto an LN2-cooled InSb detector. The resultant signal
is ampli ed, digitized, and transferred to a PC for real-time
tting to an exponential decay. The determined time constant
is divided into the cavity optical transit time to yield the per
pass fractional cavity intensity loss.
The water clusters were generated in a pulsed supersonic
expansion. The helium carrier gas was bubbled through a
reservoir of room temperature water, and directed into a 4 in.
slit source19 contained within a Roots pumped vacuum
chamber. Various methods were used to systematically ad
just the expansion conditions, including altering the source
stagnation pressure and limiting the amount of water in the
expansion with a needle valve, as discussed below.
III. RESULTS
Figure 1 shows a survey scan of the entire O – D stretch
ing spectral region, with the band locations and most prob
able spectral assignments given in Table I. As expected, the
spectrum resembles the O – H stretching spectrum observed
for H2O clusters under similar conditions. As such, many of
the features can be assigned by inspection. The bands sepa
rate into characteristic absorptions regions, wherein the
free’’ O – D stretches are tightly grouped around 2700
cm 1, while the bonded’’ stretches exhibit large red-shifts,
extending hundreds of wave numbers toward lower fre
quency. These red-shifts are a direct measure of the coopera
tive effects within the hydrogen-bond network.
The least red-shifted of the bonded stretches belongs to
the dimer. While H2O dimer stretch was found to be severely
lifetime broadened,11,18 the D2O cluster shows well-resolved
rotational structure of a parallel transition, permitting a de
tailed analysis. This band system, occurring at 2632 cm 1
Fig. 3.2 , is the most intense of the observed ( D2O) 2 bands.
Two main progressions can be identi ed, despite the signi -
cant spectral congestion caused by the tunneling splittings
and the parallel band structure. A close inspection reveals
that the weaker progression lacks transitions involving the
J 0 state, possesses a Q-branch, and exhibits a splitting in
the high-J rotational lines, indicating that it results from a
transition of a nearly symmetric rotor. Therefore,
we assign both of these progressions to the A 1 symmetry
component of the acceptor switching doublet. With this as
signment, these progressions were t to a standard energy
level expression to derive molecular constants for the vibra
tionally excited state. A simulation based on these constants
is also shown in Fig. 2, while the generated constants are
listed in Table II.

taken under expansion conditions favoring the formation of small clusters
( n 10) but with a high degree of internal cooling see text for details .
From ab initio integrated absorption cross sections Ref. 22 , we estimate
the density of trimers and tetramers in the expansion 1 cm from the
ori ce to be 3 1013/ cm3, and 7 1012/ cm3, respectively.
TABLE I. Measured band positions and assignments for ( D2O) n clusters.
Shift relative to D2O monomer anti-symmetric stretch 2789 cm 1 .
FIG. 2. IR-CRLAS spectrum of the ( D2O) 2 -bonded O – D stretch. Below is
a simulation based on the molecular constants listed in Table II and a rota
tional temperature of 10 K. The sticks represent D2O monomer transitions,
which were used to frequency calibrate the data.

O – H stretches. All constants given in cm 1.
A third, even weaker progression can also be identi ed
within this band system, which presumably corresponds to
the other acceptor switching component ( A 2 symmetry .
This tunneling motion, which is the only one of the three
presently accepted feasible tunneling pathways that does not
require breaking a hydrogen bond, is also the only one that
commonly produces large enough splittings to be resolved at
the present resolution. Assuming that the splittings from the
other two tunneling motions donor – acceptor interchange
and bifurcation are unresolved, the intensity ratio of the ac
ceptor tunneling components is expected to be 2:1 based on
nuclear spin statistics, which agrees well with the present
results. Unfortunately, this progression is too weak to permit
rotational analysis.
The donor free stretch, measured near 2765 cm 1, ex
hibits structure similar to the bonded stretch Fig. 3 , aside
from the lack of observable subbands belonging to the A 2
states. We assume that these exist, but in this case are coin
cidentally beneath rather than in between the A 1 transitions.
Accordingly, we have analyzed this band in the same manner
as the bonded stretch by assigning all of the strong lines to
A 1 symmetry. The tted constants are given in Table II.
In Fig. 4, IR-CRLAS spectra of H2O Fig. 4 a and D2O
Fig. 4 b clusters are directly compared, while the ratios of
the frequencies of the H2O bands to those of the correspond
ing D2O bands are plotted in Fig. 4 d as a function of cluster
size. The monotonic shape of this plot indicates that all of
these bands arise from single-donor stretching vibrations,
which are predicted to show increasing red-shifts with in
creasing cluster size. This shift depends on both the vibra
tional reduced mass and the force constant ( k / ) , how
ever, the ratio of these shifts among isotopomers should
depend primarily on the reduced masses, as the anharmonic
ity is expected to be small for these high frequency vibra
tions. Therefore, because OH / OD OD / OH, the trend
in Fig. 4 d can be interpreted as an increasing heavy atom
involvement in the vibrations of larger clusters due to in
creased delocalization of the vibrational motion, as predicted
by theory.20

and simulation based on the constants in Table II.
FIG. 4. Comparison of H2O and D2O cluster absorption spectra and ab initio
estimates. a IR-CRLAS H2O cluster spectra. Sticks represent the ab initio
predictions for ( H2O) 3 and ( H2O 4 from Ref. 14. These values, when scaled
by 0.975 as shown , agree quite well with the measured band positions. b
D2O cluster data obtained under similar conditions as in a . In this case, the
ab initio values Ref. 22 are scaled by 0.98, but the agreement with the
experimental results is somewhat poorer than in a . c D2O clusters in an
argon matrix at 7 K Ref. 13 . Note the frequency scale is the same as in b ,
although shifted by 17 cm 1. d Plot of the ratio of vibrational frequencies
of the corresponding single-donor stretches in H2O and D2O clusters vs
cluster size. This trend re ects the increasing heavy atom involvement in the
vibrational motion for the larger clusters.
To more effectively discriminate the band shapes and
spectral carriers of the various absorption features, two
slightly different cluster source con gurations were em
ployed. First, we employed the standard’’ con guration of
bubbling the helium carrier gas through a 25 °C water reser
voir, saturating it with water vapor, and routing it directly to
the pulsed slit jet. The water cluster spectra were then re
corded Fig. 5 a as a function of carrier gas pressure mea
sured before the bubbler . With backing pressures below 1
atm, only small clusters are observed,18 and apparently only
with a moderate degree of internal cooling see below . As
the source backing pressure is raised, the characteristic rota
tional and vibrational temperatures decrease. This is mani
fested as a narrowing of the band shapes, causing the more
closely spaced features to become resolved. The colder ex
pansions also naturally increase the degree of clustering.
This, combined with the relatively high absolute concentra
tion of water in the expansion 1% , results in the produc
tion of very large clusters at source backing pressures ex
ceeding 3 atm. In fact, the IR spectrum of these ice
nanoparticles’’ resembles that of amorphous ice,18 a highly
disordered bulk phase that forms when water vapor deposits
slowly on a cryogenic 4 – 100 K substrate.
In the second con guration, the water/He mixture was
slightly overpressurized, and admitted into a primary carrier
gas ow through a needle valve. This was done to nely
regulate the water concentration in the resulting mixture,
without changing the total stagnation pressure. With this ap
proach, a relatively constant expansion temperature is main
tained as the water concentration is adjusted. The band
shapes are observed to remain constant using this procedure
due to the approximately constant beam temperature Fig.
5 b , which allows the variations of the band intensities with
respect to changes in water concentration to be recorded
more accurately. This reproducible control over the relative
concentrations of the individual clusters aids in carrier iden
ti cation through comparison of the relative growth rates of
the individual features. Techniques similar to this have been
used extensively in matrix isolation spectroscopy to deter
mine spectral carriers, viz. varying the deposition concentra
tion or annealing the matrix.13,21 Additionally, by limiting
the total amount of water vapor in the carrier gas, a more
accurate characterization of the individual band shapes at
very low temperatures can be obtained without the interfer
ence of the much larger ice like’’ clusters that would oth
erwise result at higher backing pressures.
IV. DISCUSSION
A. D2O dimer
In Fig. 6, the corresponding H2O and D2O dimer bonded
stretches, as measured by CRLAS, are shown for compari
son. The severe lifetime broadening apparent in the H2O
band is noticeably absent in D2O. The increased reduced
mass, reduced excitation energy, and higher binding energy
in the D2O form of the dimer apparently allow for a signi -
cantly longer predissociation lifetime. However, a close in
spection of individual lines in the D2O case reveals that life
time broadening still contributes to the measured lineshape,
producing smooth line shapes with no traces of substructure.
This structure, which is observed in the corresponding accep
tor anti-symmetric stretch, is expected from the triplet split
ting caused by donor – acceptor interchange tunneling. There
fore, we can use the measured linewidths to estimate the
excited-state lifetime for both isotopomers. For H2O, this
results in a lifetime of 80 ps 0.2 cm 1 , while for D2O the
lifetime increases from this by a factor of 40 to about 5 ns.
Characterizing the relative predissociation dynamics in
( H2O) 2 and ( D2O) 2 in detail would be a most interesting
theoretical project.
As was the case for H2O clusters, we have not observed
the acceptor symmetric stretch. Studies of water clusters in
cryogenic matrices show that the symmetric stretch absorp
tion intensity is substantially weaker by about a factor of
10 than that of the anti-symmetric stretch.13,21 Considering
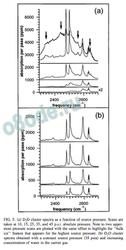
FIG. 5. a D2O cluster spectra as a function of source pressure. Scans are
taken at 10, 15, 25, 35, and 45 p.s.i. absolute pressure. Note to two upper
most pressure scans are plotted with the same offset to highlight the bulk
ice’’ feature that appears for the highest source pressure. b D2O cluster
spectra obtained with a constant source pressure 35 psia and increasing
concentration of water in the carrier gas.
the signal-to-noise with which we observe the anti
symmetric stretch,16 this reduction in intensity is suf ciently
large to explain its absence in the spectrum. Nevertheless,
the matrix results can be used to gain a good understanding
of where the band is likely to be located in the gas phase.
The presence of the matrix induces a remarkably uniform
red-shift of 17 cm 1 from the corresponding the gas phase
frequencies, regardless of cluster size Fig. 4 . This locates
the missing gas phase band near 2680 cm 1.
B. Cyclic clusters: n 3 – 5
A close inspection of the absorption bands of the small
cyclic clusters generated at low expansion temperatures re
veals a number of subtle features. Most notably, both the
trimer and tetramer peaks show partially resolved shoulders.
In both cases, the variation of this structure with changes in
water concentration Fig. 5 b indicates that these belong to
the same cluster as the adjacent dominant peak. For the tri
mer, the shoulder appears at lower frequency relative to the
main peak. While a very similar feature is also clearly ob
served in matrix isolation studies Fig. 4 b ab initio MP2
calculations 20 22 predict two IR active bands separated by 6
cm 1, with the weaker band by 8% at higher energy.
This is interesting because ( H2O) 3 exhibits a partially
resolved blue-shifted feature Fig. 4 a , which is in better
agreement with theory.14 Both features in H2O spectrum
were established as trimer bands by the recent work of
Huisken and co-workers, wherein gaseous free water
clusters8 and water clusters embedded in large liquid helium
clusters23 were examined. They observe a 13 cm 1 splitting
for ( H2O) 3 embedded in helium nanomatrices,’’ while the
gaseous cluster band showed a signi cant broadening that
shaded toward higher frequency. We nd a splitting of 11
cm 1, which agrees well with the previous results, including
MP2 calculations,14 which predict two IR-active bands split
by 9 cm 1, with a third, primarily Raman-active transition
red-shifted by an additional 60 cm 1. However, theory pre
dicts the two IR-active modes should have roughly equal
intensity. This agrees only marginally with the experimental
results, which exhibit a 3:1 intensity ratio between the fea
tures.
Concerning the assignment of the partially resolved fea
ture on the high frequency side of the main ( D2O) 4 peak, the
results of our growth-rate studies mentioned above are sup
ported by the following arguments. Matrix isolation studies
show a similar feature, which was tentatively assigned to the
tetramer.13 Additionally, the most intense vibrational modes
of clusters larger than the pentamer are predicted to be the
single-donor stretches,15 which should be found at lower fre
quencies than the 2477 cm 1 ( D2O) 5 band. Since the feature
in question appears stronger than any found in this region,
the likelihood of the carrier being larger than the pentamer is
small. However, as for the trimer, ab initio calculations ap
parently overestimate the splitting between these bands,22
predicting two IR-active modes a strong degenerate mode
and a much weaker, nondegenerate mode separated by 25
cm 1, which should be compared with the 4 cm 1 splitting
presently observed. For ( H2O) 4 , our observed splitting is
26 cm 1, which agrees somewhat better with the predicted
value of 38 cm 1.14
dicted and measured relative band intensities of these modes
is poor: a 200:1 intensity ratio is predicted, while we observe
3:1.
In contrast with the smaller cyclic clusters, both ( H2O) 5
and ( D20) 5 absorptions appear as single narrow peaks at
low temperature . While the reasons for this are not obvious,
there exists at least one notable difference between the pen
tamer and the smaller ring clusters, which is that the
puckered-ring oxygen framework of the pentamer is consid
erably oppier’’ than the planar rings of the smaller clus
ters. Therefore, the coupling between the intraand intermo
lecular vibrational modes is probably considerably stronger
than in the trimer or tetramer.
Finally, it is easily seen in Fig. 5 a that at higher expan
sion temperatures lower stagnation pressures the absorption
pro les extend 50 – 100 cm 1 from the sharp bandhead like
features toward higher frequency. These pro les sharpen as
the source stagnation pressure is raised causing the expan
sion temperature to decrease. Because the energy spreads
exhibited in these spectra are far too large to be explained by
a single rovibrational manifold, the most likely explanation
for this behavior is that the low-lying intermolecular vibra
tional modes 20 – 100 cm 1 are being thermally populated
at low stagnation pressures. For this to be the case, the fre
quencies of these modes must be increasing in the O – D
stretching excited state to explain the shading toward higher
frequency.

FIG. 6. Comparison of the corresponding dimer bonded stretches ( D2O,
upper; H2O, lower highlighting the rapid predissociation in ( H2O) 2 . By
comparing linewidths, we estimate a factor of 40 reduction in the upper state
The absorption feature at 2395 cm 1 is analogous to a
band assigned to the hexamer in the H2O cluster spectrum at
3220 cm 1.18 This appears to be the appropriate assignment
in the present case as well. Ab initio calculations indicate that
bands with such large red-shifts should appear for single
donor chromophores in clusters containing double hydrogen
bond-donating monomers, while the double-donor stretches
themselves are predicted to absorb more weakly in the
2500 – 2600 cm 1 region.15 As terahertz laser VRT spectros
copy studies indicate that the hexamer is the smallest cluster
to contain double donors,2 and since this feature is the rst to
appear in this region as the expansion conditions are altered
to increase clustering, we are con dent that this band is in
deed due to the hexamer.
Several other discrete absorption features also apparently
belong to small nonplanar clusters that are larger than the
pentamer. The most notable are found at 2640 cm 1, 2570
cm 1, 2450 cm 1, and 2340 cm 1 marked by arrows in Fig.
5 a . These features develop subsequently to the hexamer
band as the source stagnation pressure is raised, and eventu
ally become considerably larger than their respective maxi
mum intensities in Fig. 5b, wherein the amount of water in
the expansion was limited. This behavior is clearly unlike the
smaller cluster bands ( n 6 ) . However, the discrete nature
of these absorptions indicates that the responsible clusters are
either fairly small ( n 20) or highly symmetric, or both.
The 2340 cm 1 absorption probably corresponds to the
cubic octamer, continuing the trend of sequential red-shifts
of single-donor chromophores with increasing cluster size.
This band is analogous to the 3180 cm 1 feature found in the
H2O cluster spectrum. The recent benzeneH2O 8 study of
Gruenloh et al.3 provides strong support for this assignment,
as three bands centered around 3150 cm 1 were observed in
their study. The 2640 cm 1 absorption is interesting because
it is the only prominent feature to occur blue-shifted relative
to the dimer bonded stretch. While ab initio studies of the
octamer show bands with signi cant absorption intensity in
this region,15 still larger clusters, and possibly the hexamer
and heptamer as well, could also have bands in this region. It
is not possible to de nitively assign this feature at this time,
however, we can at least assume that the responsible cluster
is larger than the pentamer, as the cyclic clusters are highly
unlikely to have strong bands in this region. Interestingly, the
most likely H2O analog of this feature is the weak absorption
at 3580 cm 1, which is not blue-shifted relative to the dimer.
Concerning the two remaining features, which are possibly
double-donor stretching bands, not much else can be said
aside from the assignment to the size range given above.
Clearly, high level ab initio calculations on these larger wa
ter clusters would be most useful.
As the pressure is further increased, a very broad con
tinuum absorption centered around 2500 cm 1 and extending
between 2700 and 2200 cm 1 becomes apparent, which is
analogous to the liquidlike’’ feature discussed previously
for the case of H2O clusters.18 The clusters contributing to
this feature are estimated to be in the n 20 – 100 range. At
still higher pressures, a broad icelike’’ absorption due to
very large clusters ( n 100) becomes signi cant. As ex
pected with the transition from medium to the large sized
clusters, the spectrum narrows to 200 cm 1 FWHM and
shifts to the red by 50 cm 1 . The narrowing re ects the
increasing order in the larger clusters as the contributions
from the edges’’ of the cluster become less signi cant,
while the red-shift arises from that fact that the vibrations are
delocalized throughout the cluster, and will therefore experi
ence less quantum con nement’’ as the clusters grow
larger. The appearance of this ice feature occurs quite sud
denly as the pressure is raised, growing by a factor of at least
3 in the nal pressure increment in Fig. 5a. This suggests that
a transition point is reached when clusters large enough to
act as nucleation sites are produced.
ACKNOWLEDGMENTS
This work was supported by the Chemical Physics Pro
gram of the Air Force Of ce of Scienti c Research, and by
the Physical Chemistry Division of the National Science
Foundation.
1
K. Liu, J. D. Cruzan, and R. J. Saykally, Science 271, 929 1996 .
2
K. Liu, M. G. Brown, C. Carter, R. J. Saykally, J. K. Gregory, and D. C.
Clary, Nature London 381, 501 1996 .
3
C. Gruenloh, J. Carney, C. Arrington, T. S. Zwier, S. Y. Fredericks, and
K. D. Jordan, Science 276, 1678 1997 .
4
O. Mishima, Nature London 392, 109 1998 .
5
D. F. Coker, R. E. Miller, and R. O. Watts, J. Chem. Phys. 82, 3554
1985 .
6
M. F. Vernon, D. J. Krajnovich, H. S. Kwok, J. M. Lisy, Y. R. Shen, and
Y. T. Lee, J. Chem. Phys. 77, 47 1982 .
7
R. H. Page, J. G. Frey, Y. R. Shen, and Y. T. Lee, Chem. Phys. Lett. 106,
373 1984 .
8
F. Huisken, M. Kaloudis, and A. Kulcke, J. Chem. Phys. 104, 17 1996 .
9
R. N. Pribble and T. S. Zwier, Science 265, 75 1994 .
10
S. Wuelfert, D. Herren, and S. Leutwyler, J. Chem. Phys. 86, 3751 1987 .
11
Z. S. Huang and R. E. Miller, J. Chem. Phys. 91, 6613 1989 .
12
A. Engdahl and B. Nielander, J. Chem. Phys. 86, 4831 1987 .
13
G. P. Ayers and A. D. E. Pullin, Spectrochim. Acta 32A, 1629 1976 .
14
S. S. Xantheas and T. H. Dunning Jr., J. Chem. Phys. 99, 8774 1993 .
15
R. Knochenmuss and S. Leutwyler, J. Chem. Phys. 96, 5233 1992 .
16
J. B. Paul, R. A. Provencal, and R. J. Saykally, J. Phys. Chem. 102, 3279
1998 .
17
J. J. Scherer, J. B. Paul, A. O’Keefe, and R. J. Saykally, Chem. Rev. 97,
25 1997 .
18
J. B. Paul, C. P. Collier, J. J. Scherer, A. O’Keefe, and R. J. Saykally, J.
Phys. Chem. 101, 5211 1997 .
19
K. Liu, R. S. Fellers, M. R. Viant, R. P. McLaughlin, M. G. Brown, and R.
J. Saykally, Rev. Sci. Instrum. 67, 410 1996 .
20
E. Honegger and S. Leutwyler, J. Chem. Phys. 88, 2582 1988 .
21
R. M. Brentwood, A. J. Barnes, and W. J. Orville-Thomas, J. Mol. Spec
trosc. 84, 391 1980 .
22
M. Schuetz, W. Klopper, S. Graf, and S. Leutwyler to be published .
23
R. Fro¨ chtenicht, M. Kaloudis, M. Koch, and F. Huisken, J. Chem. Phys.
105, 6128 1996 .
10206 J. Chem. Phys., Vol. 109, No. 23, 15 December 1998 Paul et al.